Code: Alles auswählen
# -*- coding: utf-8 -*-

import matplotlib.pyplot as plt
from mpl_toolkits.mplot3d import Axes3D
from pylab import rand   #  oder auch: from pylab import *
from pylab import show
from pylab import array

fig = plt.figure(figsize=(10, 6))
ax = plt.gca(projection='3d')

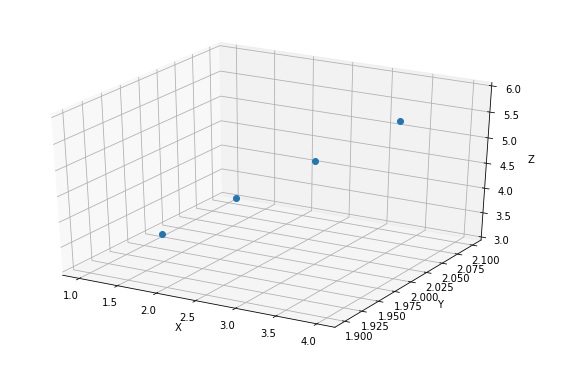
x = array([1, 2, 3, 4])
y = array([2, 2, 2, 2])

ax.plot(x, y, x+y, 'o')
ax.set_xlabel('X')
ax.set_ylabel('Y')
ax.set_zlabel('Z')
show()X = 1 und Y = 1 funktioniert nicht, es muss auch bei nur einem Punkt als array definiert sein.
Statt x = array([1, 2, 3, 4]) und y = array([2, 2, 2, 2])
Kann man auch verwenden
x = rand(20) und y = rand(20). Dies zeichnet aus 20 Zufallszahlen Punkte. Wobei x und y die gleiche Anzahl haben müssen.
Plotten von Punkten