Plot 3D
Verfasst: Di Feb 27, 2018 10:55 am
# -*- coding: utf-8 -*-
from mpl_toolkits.mplot3d import Axes3D # Bibliotheken importieren
import numpy as np
import matplotlib.pyplot as plt
plt.figure(figsize=(12.0, 6)) # grösse des Fensters anpassen
x, y = np.mgrid[-3:3:30j, -3:3:30j] # Variablen zuweisen
z = (x**2+y**3)*np.exp(-x**2-y**2)
cmap = 'coolwarm'
fig = plt.figure()
ax = fig.gca(projection='3d')
ax.plot_surface(x, y, z, rstride=1, cstride=1, cmap=cmap, alpha=0.7)
cset = ax.contourf(x, y, z, zdir='z', offset=-0.9, cmap=cmap)
ax.set_xlabel('$x$', size='xx-large') # Achsen
ax.set_ylabel('$y$', size='xx-large')
ax.set_zlabel('$z$', size='xx-large')
ax.set_zlim(-0.8, 0.5)
plt.draw()
Ich fand es ist ein schönes Beispiel für 3 D.
Entnommen wurde es von: https://gertingold.github.io/pythonnawi/graphics.html bei: In [49].
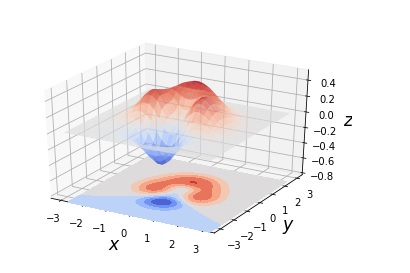
from mpl_toolkits.mplot3d import Axes3D # Bibliotheken importieren
import numpy as np
import matplotlib.pyplot as plt
plt.figure(figsize=(12.0, 6)) # grösse des Fensters anpassen
x, y = np.mgrid[-3:3:30j, -3:3:30j] # Variablen zuweisen
z = (x**2+y**3)*np.exp(-x**2-y**2)
cmap = 'coolwarm'
fig = plt.figure()
ax = fig.gca(projection='3d')
ax.plot_surface(x, y, z, rstride=1, cstride=1, cmap=cmap, alpha=0.7)
cset = ax.contourf(x, y, z, zdir='z', offset=-0.9, cmap=cmap)
ax.set_xlabel('$x$', size='xx-large') # Achsen
ax.set_ylabel('$y$', size='xx-large')
ax.set_zlabel('$z$', size='xx-large')
ax.set_zlim(-0.8, 0.5)
plt.draw()
Ich fand es ist ein schönes Beispiel für 3 D.
Entnommen wurde es von: https://gertingold.github.io/pythonnawi/graphics.html bei: In [49].