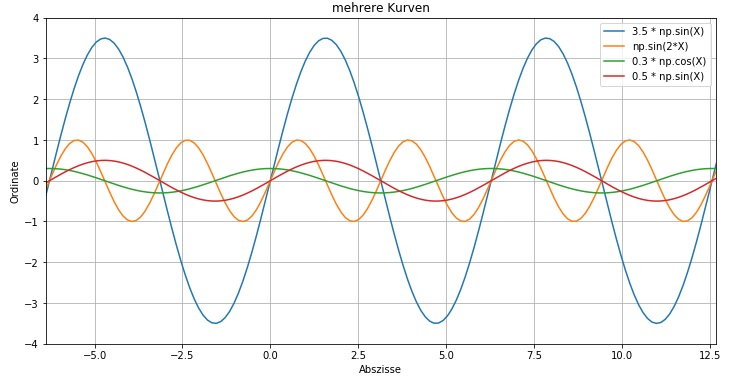
Plot Sinus - mehrfacher in einem Fenster
Verfasst: Sa Feb 24, 2018 12:22 pm
Code: Alles auswählen
# -*- coding: utf-8 -*-

import numpy as np                                          # np.pi ist aus Bibliothek numpy Pi(3,1416..) für np
import matplotlib.pyplot as plt
from pylab import *

plt.figure(figsize=(12.0, 6))				# grösse des Fensters anpassen
glat = 160						                [color=#0040FF]# Variablen[/color]
X = np.linspace(-2.3 * np.pi, 4.1 * np.pi, glat) 	[color=#0040FF]# Wertebereich[/color]

F1 = 3.5 * np.sin(X)					[color=#0040FF]# Berechnung Kurve 1[/color]
F2 = np.sin(2*X)					        [color=#0040FF]# Berechnung Kurve 2[/color]
F3 = 0.3 * np.cos(X)					[color=#0040FF]# Berechnung Kurve 3[/color]
F4 = 0.5 * np.sin(X)					[color=#0040FF]# Berechnung Kurve 4[/color]

grid(True)						        [color=#0040FF]# Gitterlinien einschalten[/color]
title('mehrere Kurven')				[color=#0040FF]#Beschriftungen[/color]
xlabel('Abszisse')
ylabel('Ordinate')

startx, endx = -2 * np.pi - 0.1, 4*np.pi + 0.1	[color=#0040FF]# Legt die Grösse der x-Achse fest[/color]
starty, endy = -4, 4					[color=#0040FF]# legt die Grösse der y-Achse fest[/color]
plt.axis([startx, endx, starty, endy])		[color=#0040FF]# Stellt die Achsen dar[/color]

plt.plot(X,F1,label='3.5 * np.sin(X)')		[color=#0040FF]# Kurve 1 mit Legende[/color]
legend()
plt.plot(X,F2,label='np.sin(2*X)')		[color=#0040FF]# Kurve 2[/color]
plt.plot(X,F3,label='0.3 * np.cos(X)')		[color=#0040FF]# Kurve 3[/color]
plt.plot(X,F4,label='0.5 * np.sin(X)')		[color=#0040FF]# Kurve 4[/color]

legend()						       [color=#0040FF]# Legende im Fenster anzeigen[/color]
plt.show()						       [color=#0040FF]# Plot anzeigen[/color]